

Recommended Software
CloudBerry Explorer for Amazon S3 1.5.1.39
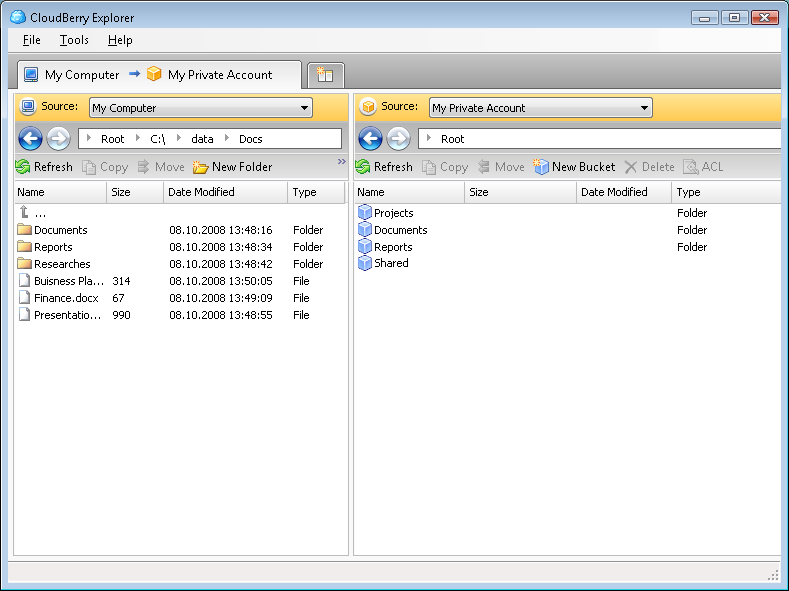
CLOUDBERRY EXPLORER FOR AMAZON S3 CloudBerry S3 Explorer makes managing files in Amazon S3 EASY. By providing an industry leading user interface (GUI) to Amazon S3 accounts, files, and buckets, CloudBerry lets you manage your files on cloud just as you would on your own local computer. New...
DOWNLOADSoftware Catalog
 Android Android |
Business & Productivity Tools |
| Desktop |
Developer Tools |
| Drivers |
Education |
| Games |
Home & Personal |
| Internet & Networking |
Multimedia & Design |
| Operating Systems |
Utilities |


Rt-Science Tools2D for Delphi Feedback System
Rt-Science Tools2D for Delphi Info
License: Shareware | Author: Rt-Science | Requirements: Borland Delphi 4, 5, 6, 7, 8, 2005, 2006 or C++ Builder 4, 5, 6 VCL
Rt-Tools2D is a selection of components to generate two dimensional Cartesian plots: *TRtCaptionEdit: This is a special edit control supporting enhanced styles as bold, italic, underline, strikeout, subscript, superscript and symbol font. This is especially interesting to alter TRtLabels which supports the same styles. *TRtLabel: Label supporting enhanced styles as bold, italic, underline, strikeout, subscript, superscript and symbol font. It can be drawn in any angle. *TRtGraph: The main component of a 2D-plot. Just place on a form and the plot will be drawn automatically. Supports unlimited number of line series, unlimited number of axis in any position, auto zooming, grids ... *TRtAxis: The axis of the 2D-Graph. You can add as many of them to the graph as you like to any position: top, bottom, left or right. You can alter fonts, scaling, tick marks ... *TRtRealVector, TRtLiveVector: The components to store the numerical data. The data added to the LiveVector will automatically update also the ranges of the connected Series, which will update the axis ranges. You can place as many Vector components as you like to a form and connect also to different series. You can add a unlimited amount of real data to each vector as to a dynamic array or a list which automatically adjusts its size. *TRtLineSeries, TRtDataSeries, TRtDataWithErrorSeries: These components represent the lines of the 2D-Graph. You can place a unlimited number of Series to the form and connect to the 2D-Graph. The X-and Y-data can connect to any data vector as described above. The data can also be assigned any Axis available with the graph. *TRtLinerRegressionLine, TRtPolynomLine, TRtFittedLine, TRtInterpolatedLine, TRtDifferential, TRtIntegral: Calculated Lines updating automatically. *TRtLegend: Place this component to a form or inside the 2D-Graph and connect to the graph. It will automatically display a legend including the settings of the Series and their captions.
Notice: * - required fields
Rt-Science Software
 Rt-Plot - Rt-Plot is a tool to generate Cartesian X/Y-plots from scientific data. You can enter and calculate tabular data. View the changing graphs, including linear and non linear regression, interpolation, differentiation and integration, during entering.
 Top Downloads
- Formats Customizer
- Active Audio Record Component
- A Better Switchboard for MS Access
- HTML Snapshot
- TIFF To PDF ActiveX Component
- 2D CAD View Plugin for Total Commander
- 1-Hour Search Engine Optimization Crash Course
- Active TTS Component
- 0-Code HTML Converter
- User Time Control

New Downloads
- Formats Customizer
- User Time Control
- HTML Snapshot
- Active TTS Component
- Active Audio Record Component
- ASPThumb
- 3D Active Button Magic
- HTML2PDF Add-on
- RSS Planter
- Directory Dominator

New Reviews
- jZip Review
- License4J Review
- USB Secure Review
- iTestBot Review
- AbsoluteTelnet Telnet / SSH Client Review
- conaito VoIP SDK ActiveX Review
- conaito PPT2SWF SDK Review
- FastPictureViewer Review
- Ashkon MP3 Tag Editor Review
- Video Mobile Converter Review
Actual Software
| Link To Us
| Links
| Contact
Must Have
| TOP 100
| Authors
| Reviews
| RSS
| Submit