Recommended Software

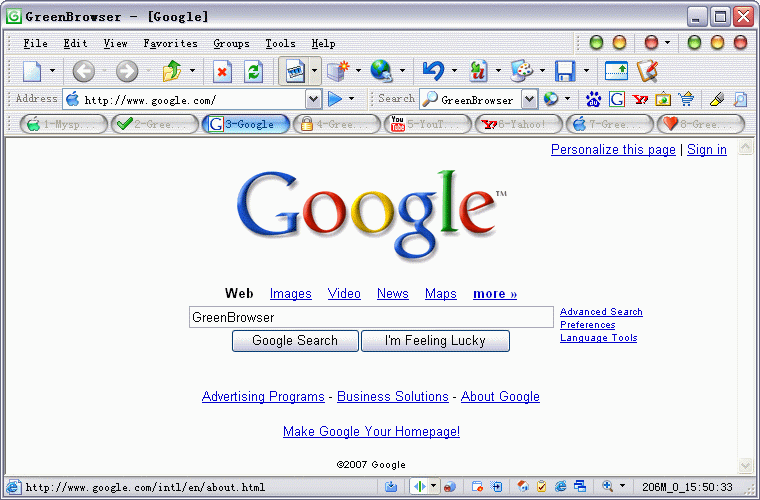
GreenBrowser 4.2.0712
GreenBrowser is a multiple windows browser based on IE with other powerful features. Such as: - Quick Key, Collector, Mouse Gesture, Mouse Drag, Ad Filter, Search Engine, Page Back Color, Toolbar Skin, Proxy, Tab Bar, Auto Scroll, Auto Save, Auto Fill Form, Start Mode, Auto Hide Bar, Mouse Drag...
DOWNLOADSoftware Catalog
 Android Android |
 Business & Productivity Tools Business & Productivity Tools |
 Desktop Desktop |
 Developer Tools Developer Tools |
 Drivers Drivers |
 Education Education |
 Games Games |
 Home & Personal Home & Personal |
 Internet & Networking Internet & Networking |
 Multimedia & Design Multimedia & Design |
 Operating Systems Operating Systems |
 Utilities Utilities |


VisLog Download
VisLog 2.3
Using VisLog, the user will be able to enter borehole information including but not limited to their depth, coordinates, ground water level, etc. and have a three dimensional interactive view of the underground subject project. The ultimate aim of VisLog is to help users with making an image of the soil layers close to real condition. Input data can be taken from gINT, the most widely used borehole log software in the world. We support gINT files.
Input data can be taken from gINT, the most widely used borehole log software in the world. Also user could enter data using internal test-hole editor. When the model is built upon the borehole information provided by user, the 3-dimensional model can rotate, zoom in/out, print and even saved as graphic formats.
With intelligent engine of VisLog, generating soil profiles between boreholes is as easy as 1-2-3. VisLog can even be used for ground improvement projects to visualize the results. The developers of VisLog have presented a paper in GeoHalifax conference (2009) regarding a ground improvement project in Canada which was processed using VisLog.
Size: 5.5 MB | Download Counter: 7
If VisLog download does not start please click this:
Download Link 1
Can't download? Please inform us.
Related Software
 Well Logger - Well Logger lets you create soil boring logs and well construction diagrams. Project engineers and geologists can use Well Logger on a laptop at the worksite to quickly complete necessary documentation -- usually during available drilling downtime.
 Awesome Geology from Space Screen Saver - A screen saver with beautiful NASA/JPL radar images of geological formations. All photos are high-quality images. This 5-photo version is free, the Gold Edition has 42 photos and may be purchased at Awesome-Screens.com
 LateralK - LateralK is a simple software for calculating lateral earth pressure coefficients and forces behind retaining walls in static and earthquake condition based on Rankine/ Coulumb formulae and also Mononobe/ Okabe methods.
 ThreeDimSim:3D Mechanics simulator - ThreeDimSim is a powerful 3D mechanics simulation and rendering application. A 3D scene is defined by script using simple shapes and imported meshes from CAD files. Mechanics are simulated and rendered and can be analysed and exported.
 Quakeshakes - Quakeshakes shows you recent worldwide earthquake activity and displays them on an interactive map with info on location, date, time and size, giving you a dramatic visual record of the seismic activity during the past 24 hours or week.
 BeamProps - This software is used to calculate section properties like area, moment of inertia, radius of gyration, etc for more than 25 sections and shapes. These equations are taken from "Roark's formulas for stress and strain (7th Edition)" book.
 Chess Vision Trainer - Chess Vision Trainer is a chess training system to improve your visualization and move calculation skills in Chess. You are always forced to look ahead of the chess position you see on the board.
 JGraph - JGraph is the leading Open Source Java Graph Visualization Library. It follows Swing design patterns to provide an API familiar to Swing programmers and functionality that provides a range of features to implement workflows, networks, flowcharts...
 PlotLab .NET - PlotLab is a set of .NET 2.0-4.0 components for very easy and fast Data Visualization. Allows very fast display in a Plot/Scope/Chart or Waterfall form. Great for FFT Visualization! Free for non-commercial use.
 PlotLab VC++ - PlotLab is a set of Visual C++ components for very easy and fast Data Visualization. They allow very fast display in a Plot/Scope/Chart or Waterfall form. Great for FFT Visualization! Free for non-commercial use.

 Top Downloads
- SurGe
- Easy Measure Converter
- GSA Image Analyser
- Audio Spectrum Analyzer - OscilloMeter
- Audio Multi-Tone Generator
- Rimu PCB
- Satellite Image Browser
- Flow Pro
- GENOM 2005
- Advanced Pathway Painter

 New Downloads
- LateralK
- GSA Image Analyser
- RadioTelephone Tutor
- BSAcalc
- PL Table
- LeoNetCDF
- LeoCrystal
- Advanced Pathway Painter
- GENOM 2005
- Quakeshakes

New Reviews
- jZip Review
- License4J Review
- USB Secure Review
- iTestBot Review
- AbsoluteTelnet Telnet / SSH Client Review
- conaito VoIP SDK ActiveX Review
- conaito PPT2SWF SDK Review
- FastPictureViewer Review
- Ashkon MP3 Tag Editor Review
- Video Mobile Converter Review
Actual Software
| Link To Us
| Links
| Contact
Must Have
| TOP 100
| Authors
| Reviews
| RSS
| Submit


