Recommended Software

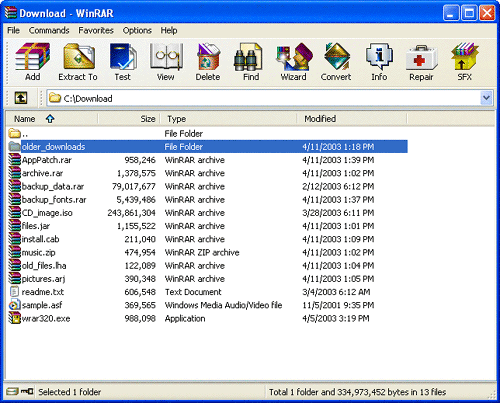
WinRAR 3.90
WinRAR is a 32-bit/64-bit Windows version of RAR Archiver, the powerful archiver and archive manager. WinRARs main features are very strong general and multimedia compression, solid compression, archive protection from damage, processing of ZIP and other non-RAR archives, scanning archives for...
DOWNLOADSoftware Catalog
 Android Android |
 Business & Productivity Tools Business & Productivity Tools |
 Desktop Desktop |
 Developer Tools Developer Tools |
 Drivers Drivers |
 Education Education |
 Games Games |
 Home & Personal Home & Personal |
 Internet & Networking Internet & Networking |
 Multimedia & Design Multimedia & Design |
 Operating Systems Operating Systems |
 Utilities Utilities |


StockChartX Download
StockChartX 5.8
For .NET, VB6, C++ and other languages: StockChartX features new charting types: 3D Candlesticks, Renko, Kagi, Three Line Break, Point & Figure, Candlevolume, Equivolume, Shaded Equivolume, Darvas Boxes,Technical Analysis and more! Now developers can leverage their knowledge and existing code to easily integrate our lightweight COM-based ActiveX stock chart control. Developing with StockChartX using VB, VB.Net, C#, Excel, VC++, and Delphi, is quick and easy. StockChartX supports both Desktop applications and web charting applications. No other charting component comes close to the flexibility and completeness of StockChartX V.5 Pro. Modulus Financial Engineering does one thing and does it right... we do financial software engineering only! What this means is that you will find features built right into StockChartX that you will not find in any other charting component, guaranteed. Features that are specific to financial applications. Finally, a charting component designed BY traders, FOR traders! With StockChartX, you can chart real-time stock data, embed objects like buy, sell, exit or custom bitmap symbols, insert text, trend lines, custom drawings, multiple indicators, overlay indicators (share scales), display charts with semi-log or linear scaling, print charts, save charts as images, save/load charts as binary files, and much more! Use StockChartX as your essential front-end data analysis tool for developing interactive financial applications. StockChartX is the perfect addition to your financial engineering toolbox. StockChartX V.5 comes with very comprehensive VB6, VC++, VB.net, C#, Delphi 7, Borland C++ Builder, and Excel example projects, each containing 1,000 to 2,000 lines of highly commented source code.
Size: 10.0 MB | Download Counter: 15
If StockChartX download does not start please click this:
Download Link 1 | Download Link 2
Can't download? Please inform us.
Related Software
 CharTTool - CharTTool is an advanced stock market charting software that instantly allows you to display several technical charts of stocks, mutual funds, currencies or market indices in intraday or end of day chart format. Technical analysis is also available.
 Smart Chart Designer - Smart Chart Designer is comprehensive charting application that supports over 40 chart types in multiple modes, meaning that literally hundreds of different styles and types are available for users.
 OT Mobile Chart - OT Mobile Chart is a free portfolio manager and charting tool for your mobile phone. With this tool on your mobile phone you can keep track of your financial quotes, anytime and anywhere. Free!
 Tradetrek Enterprise - Offers investors a complete set of stock analysis and trading strategy tools, including Live Stock Picks, Neural-Network 5-day forecast, Money Flow, Tick Chart, portfolio and risk management, Pairtrade Picks and real-time interactive charting.
 DAXA-Chart Privat - DAXA-Chart Privat is a freeware German program for analyzing and charting shares and portfolio management. It is supplied with an initial database of 120 German stocks. Download further stockmarket price updates from our homepage for free.
 Statmetrics - Statmetrics is a free cross-platform software application providing an integrated solution for analysis and modelling of financial markets.
 Chart component .Net - Chart Component .NET is a powerful charting component used to create attractive 3D and 2D charts for desktop applications and web pages using .NET technologies. 3D charting uses the OpenGL graphics engine to create sophisticated 3D charts and graphs.
 Nevron Chart for .NET - Nevron Chart for .NET is a professional charting component for WinForms and ASP.NET. It features numerous business, scientific and financial charting types, VS design time support, empty data points, built-in toolbar, flexible axes, and more.
 Java Chart Designer - Java Chart Designer is a powerful, feature rich charting Java application which lets you create charts for professionally looking presentations and reports that can be easily integrated into website as Java applet, Java apps or saved as JPEG images.
 World Stock Charts - World Stock Charts is a complete solution for Charting and Tracking Stocks, Funds and Indices with over 50 Forms of Technical Analysis built into it.

 Top Downloads
- Outlook Message Autofill
- MyCafeCup Internet Cafe WiFi CyberCafe Software.
- PrintConductor
- eTalkup
- #1 Easy Invoice Program - Free Download
- Feet and Inches Calculator
- Euro Calculator
- Magic ASCII Studio
- Best Flobo Repair Disk
- Posterita POS

 New Downloads
- PrintConductor
- Word Viewer
- Word Reader
- Absence Management System
- Word to PDF Converter
- ESBCalc Pro - Scientific Calculator
- Free PDF Converter
- HIPAA Security Rule Assistant
- Stock Quotes Pro
- Stock Predictor

New Reviews
- jZip Review
- License4J Review
- USB Secure Review
- iTestBot Review
- AbsoluteTelnet Telnet / SSH Client Review
- conaito VoIP SDK ActiveX Review
- conaito PPT2SWF SDK Review
- FastPictureViewer Review
- Ashkon MP3 Tag Editor Review
- Video Mobile Converter Review
Actual Software
| Link To Us
| Links
| Contact
Must Have
| TOP 100
| Authors
| Reviews
| RSS
| Submit


