

Recommended Software
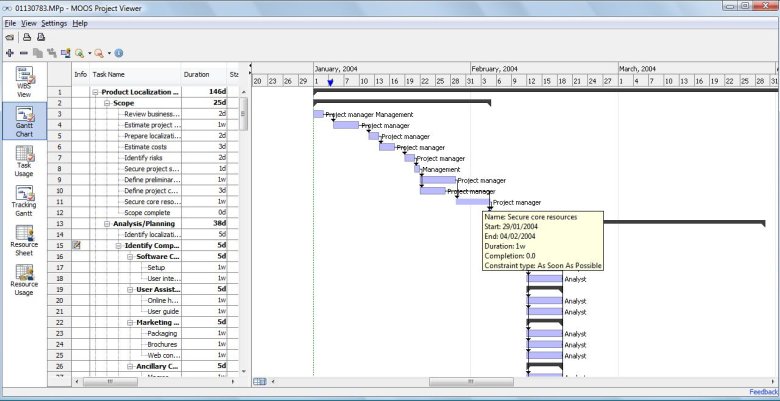
MS Project Viewer 2.8
MOOS Project Viewer is a Microsoft Project viewer that can open any MS Project file type (.mpp, .mpt, .mpx, .xml) for any Microsoft Project version (2000, 2003, 2007, 2010). Available views: WBS, Gantt chart, task sheet, resource sheet, resource usage, tracking Gantt. It is running on any Java...
DOWNLOADSoftware Catalog
 Android Android |
Business & Productivity Tools |
| Desktop |
Developer Tools |
| Drivers |
Education |
| Games |
Home & Personal |
| Internet & Networking |
Multimedia & Design |
| Operating Systems |
Utilities |


Rt-Science Tools2D for Delphi Download
Rt-Science Tools2D for Delphi 2.6.1.3
Rt-Tools2D is a selection of components to generate two dimensional Cartesian plots: *TRtCaptionEdit: This is a special edit control supporting enhanced styles as bold, italic, underline, strikeout, subscript, superscript and symbol font. This is especially interesting to alter TRtLabels which supports the same styles. *TRtLabel: Label supporting enhanced styles as bold, italic, underline, strikeout, subscript, superscript and symbol font. It can be drawn in any angle. *TRtGraph: The main component of a 2D-plot. Just place on a form and the plot will be drawn automatically. Supports unlimited number of line series, unlimited number of axis in any position, auto zooming, grids ... *TRtAxis: The axis of the 2D-Graph. You can add as many of them to the graph as you like to any position: top, bottom, left or right. You can alter fonts, scaling, tick marks ... *TRtRealVector, TRtLiveVector: The components to store the numerical data. The data added to the LiveVector will automatically update also the ranges of the connected Series, which will update the axis ranges. You can place as many Vector components as you like to a form and connect also to different series. You can add a unlimited amount of real data to each vector as to a dynamic array or a list which automatically adjusts its size. *TRtLineSeries, TRtDataSeries, TRtDataWithErrorSeries: These components represent the lines of the 2D-Graph. You can place a unlimited number of Series to the form and connect to the 2D-Graph. The X-and Y-data can connect to any data vector as described above. The data can also be assigned any Axis available with the graph. *TRtLinerRegressionLine, TRtPolynomLine, TRtFittedLine, TRtInterpolatedLine, TRtDifferential, TRtIntegral: Calculated Lines updating automatically. *TRtLegend: Place this component to a form or inside the 2D-Graph and connect to the graph. It will automatically display a legend including the settings of the Series and their captions.
Size: 7.3 MB | Download Counter: 4
If Rt-Science Tools2D for Delphi download does not start please click this:
Download Link 1
Can't download? Please inform us.
Related Software
 Rt-Plot - Rt-Plot is a tool to generate Cartesian X/Y-plots from scientific data. You can enter and calculate tabular data. View the changing graphs, including linear and non linear regression, interpolation, differentiation and integration, during entering.
 Stats Master - Add-on statistical package for MtxVec includes: 19 different distributions (PDF, CDF and inverse CDF), mean and variance for all 19 distributions, random generators for 15 distributions, parameter estimate and more...
 PlotLab VCL - Delphi/C++ Builder VCL/FMX components library for very easy and fast Data Visualization. Allows very fast display in a Plot/Scope/Chart or Waterfall form. Great for FFT Visualization! Free for non-commercial use.
 PlotLab .NET - PlotLab is a set of .NET 2.0-4.0 components for very easy and fast Data Visualization. Allows very fast display in a Plot/Scope/Chart or Waterfall form. Great for FFT Visualization! Free for non-commercial use.
 Data Curve Fit Creator Add-in - Adds data curve fitting, interpolation and data smoothing functions to Excel. Functions include polynomial fits, several types of splines, and local regressions. Filters include moving average, Gaussian smoothing and median filtering.
 PlotLab VC++ - PlotLab is a set of Visual C++ components for very easy and fast Data Visualization. They allow very fast display in a Plot/Scope/Chart or Waterfall form. Great for FFT Visualization! Free for non-commercial use.
 WebCab Probability and Stat (J2SE Ed.) - Offers functionality from Basic Statistics, Discrete Probability, Standard Probability Distributions, Hypothesis Testing, Correlation and Linear Regression
 Regression Analysis - CurveFitter - CurveFitter program performs statistical regression analysis to estimate the values of parameters for linear, multivariate, polynomial, exponential and nonlinear functions.
 WebCab Probability and Stat (J2EE Ed.) - EJB Suite offers functionality from Basic Statistics, Discrete Probability, Standard Probability Distributions, Hypothesis Testing, Correlation and Linear Regression
 Advanced Grapher - Graphing, curve fitting and calculating software. Graphs Cartesian, polar and parametric functions, graphs of tables, implicit functions and inequalities. Calculus features: regression analysis, derivatives, tangents, normals and more.
 Top Downloads
- Formats Customizer
- Active Audio Record Component
- A Better Switchboard for MS Access
- HTML Snapshot
- TIFF To PDF ActiveX Component
- 2D CAD View Plugin for Total Commander
- 1-Hour Search Engine Optimization Crash Course
- Active TTS Component
- 0-Code HTML Converter
- User Time Control

New Downloads
- Formats Customizer
- User Time Control
- HTML Snapshot
- Active TTS Component
- Active Audio Record Component
- ASPThumb
- 3D Active Button Magic
- HTML2PDF Add-on
- RSS Planter
- Directory Dominator

New Reviews
- jZip Review
- License4J Review
- USB Secure Review
- iTestBot Review
- AbsoluteTelnet Telnet / SSH Client Review
- conaito VoIP SDK ActiveX Review
- conaito PPT2SWF SDK Review
- FastPictureViewer Review
- Ashkon MP3 Tag Editor Review
- Video Mobile Converter Review
Actual Software
| Link To Us
| Links
| Contact
Must Have
| TOP 100
| Authors
| Reviews
| RSS
| Submit