

Recommended Software
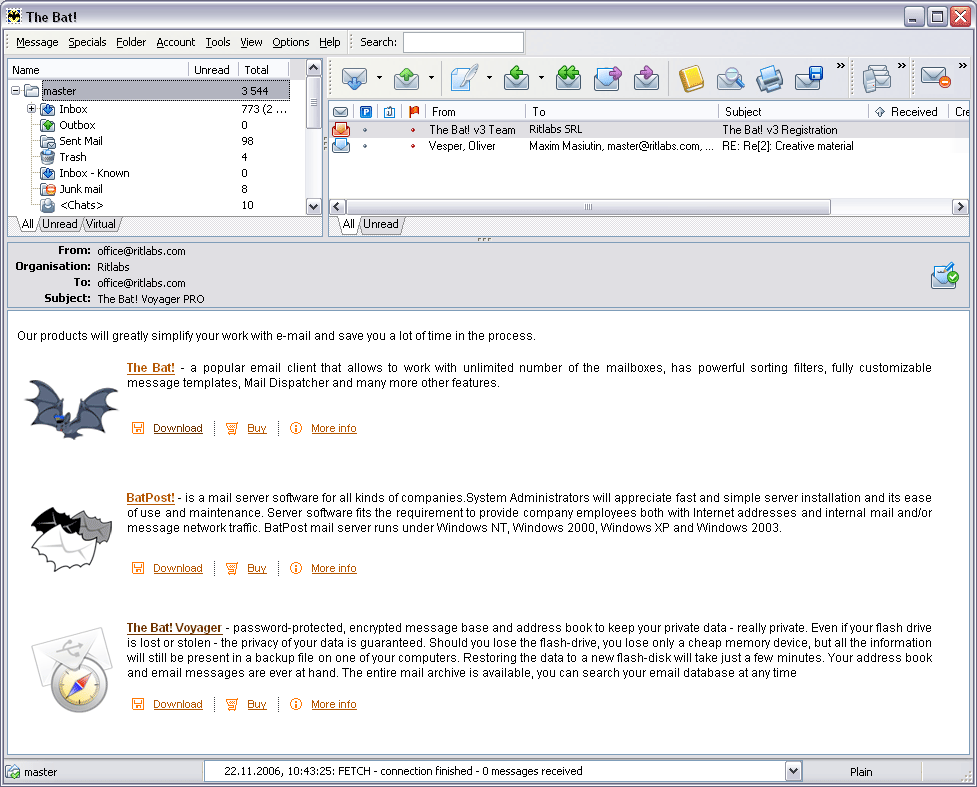
The Bat! 3.95
The Bat! is a powerful, highly configurable, yet easy to use, email client for the casual user or the power user, the home or the office. Unlimited multiple accounts and multiple users Familiar Explorer-style folders for organizing messages Easily configurable user interface with message...
DOWNLOADSoftware Catalog
 Android Android |
Business & Productivity Tools |
| Desktop |
Developer Tools |
| Drivers |
Education |
| Games |
Home & Personal |
| Internet & Networking |
Multimedia & Design |
| Operating Systems |
Utilities |


LTProf
LTProf 1.4.8
Category:
Developer Tools / Languages - Others
| Author: Lightweight Technologies
DOWNLOAD
GET FULL VER
Cost: $49.95 USD
License: Shareware
Size: 1 B
Download Counter: 11
Line level resolution
One of the best features of LTProf. Most profilers have a function-level resolution, that is, they can display a list of functions and the time spent in each one. LTProf goes further and displays graphically, on the source file, time spent by each line of code, relative to the function it belongs to. Thus if you have a long algorithm you can see which parts of it are the most time consuming.
No instrumentation, no rebuild, no time wasted
Unlike most profilers on the market LTProf does not require a rebuild or an instrumentation step. The normal build of your application can be profiled at any stage in its development, without any other adjustments.
Profiled program runs at its normal speed
Instrumented programs have additional code inserted in every function to measure the time spent, which greatly reduces the program's speed because some of the instrumented functions are called very often. It is not uncommon that slow programs become completely unusable after instrumentation.
LTProf does not change your application in any way, which means it can run at its normal speed, making your life a lot easier. The amount of processor time consumed by LTProf itself can be adjusted by setting the sampling resolution.
Profile VC++, CBuilder, Delphi and Visual Basic code
as well as any application that stores debug information in PDB/TDS files. LTProf is not language-oriented and it can analyze any program as long as it contains debug information in PDB/TDS files. It can do so even in cross-language applications, for example an EXE written in C++ that uses VB components.
Price
Compare the price of other similar applications with LTProf which retails at only $49.95
Requirements: CPU: 400+ MHz, RAM: 64Mb+, Disk:4Mb+, Video: VGA hi-color+
OS Support:
Language Support:
Related Software
Aol profiler | Borland Profiler | C Builder Profiler | C++ Profiler | Cbuilder Profiler | Code Profiler | Delphi Profiler | Php profiler | Profiler | Profiler ada | Profiling Tool | Vb Profiler | Visual Basic Profiler
 JProbe Profiler Freeware - Quest's JProbe Profiler Freeware is a special version of the industry award winning Profiler included in JProbe Suite. JProbe Profiler helps developers quickly diagnose performance bottlenecks in Java code. Available for Windows and Linux.
 Storage Profiler - Storage Profiler delivers agentless, multi-vendor storage performance monitoring. Storage Profiler gives you a comprehensive view into the health of ALL your storage devices through a single pane of glass.
 Pinnacle Game Profiler - Emulate your keyboard and mouse with your game controller, adding joystick support to almost any game! Play your favorite game with your gamepad, instead of awkward keyboard/mouse controls. Perfect for First Person Shooters and many other games!
 Tito Web Studio - Tito Web Studio is a feature rich and extremely effective quality assurance tool for web developers and QA analyst. This enterprise software consists of JavaScript debugging and profiling functions
 EngInSite PHP Editor (IDE) - EngInSite PHP Editor in an integrated development environment (IDE) that drastically simplifies creating, editing, debugging and running PHP scripts, effectively doubling and tripling productivity of programmers from the very first day you use it.
 TOAD for Oracle Freeware - TOAD?® empowers developers and DBAs to be more productive by providing an intuitive graphical user interface to Oracle. TOAD is a powerful, low-overhead tool that makes PL/SQL development faster and easier and simplifies database administration.
 Project Analyzer - Project Analyzer is a Visual Basic code analyzer, optimizer and documenter. Detect dead code and remove it. Surf your code as hypertext and call trees. Diagram and document your work. Supports VB 3-6, VB.NET and VBA.
 Guggi for Oracle - Database Development, Administration, PL/SQL programming and data analysis tool for Oracle 8.0, 8i, 9i and 10g. Are Browse the database for 32 different types of objects such as table, view, synonym, constraints, function, index, trigger, etc.
 VBto Converter - Software for converting MS Visual Basic 6.0 projects (including source code) to Microsoft VS VB.NET, C#, J#, VC.NET, VC++ (MFC), Borland Delphi, C++ Builder.
Visual Basic forms viewer and source code analyzer.
VB6 Decompiler.
VBto Converter - Software for converting MS Visual Basic 6.0 projects (including source code) to Microsoft VS VB.NET, C#, J#, VC.NET, VC++ (MFC), Borland Delphi, C++ Builder.
Visual Basic forms viewer and source code analyzer.
VB6 Decompiler.- 2d CAD Image - CAD Image DLL
Revolution in custom CAD development! Incredible speed and accuracy of DXF, DWG, HPGL, SVG, CGM files visualization. Ideal for inner industry programming with MS Visual Basic, MS Visual C++, Borland Delphi,C++Builder
 Top Downloads
- Formats Customizer
- Active Audio Record Component
- A Better Switchboard for MS Access
- HTML Snapshot
- TIFF To PDF ActiveX Component
- 2D CAD View Plugin for Total Commander
- 1-Hour Search Engine Optimization Crash Course
- Active TTS Component
- 0-Code HTML Converter
- User Time Control

New Downloads
- Formats Customizer
- User Time Control
- HTML Snapshot
- Active TTS Component
- Active Audio Record Component
- ASPThumb
- 3D Active Button Magic
- HTML2PDF Add-on
- RSS Planter
- Directory Dominator

New Reviews
- jZip Review
- License4J Review
- USB Secure Review
- iTestBot Review
- AbsoluteTelnet Telnet / SSH Client Review
- conaito VoIP SDK ActiveX Review
- conaito PPT2SWF SDK Review
- FastPictureViewer Review
- Ashkon MP3 Tag Editor Review
- Video Mobile Converter Review
Actual Software
| Link To Us
| Links
| Contact
Must Have
| TOP 100
| Authors
| Reviews
| RSS
| Submit