

Recommended Software
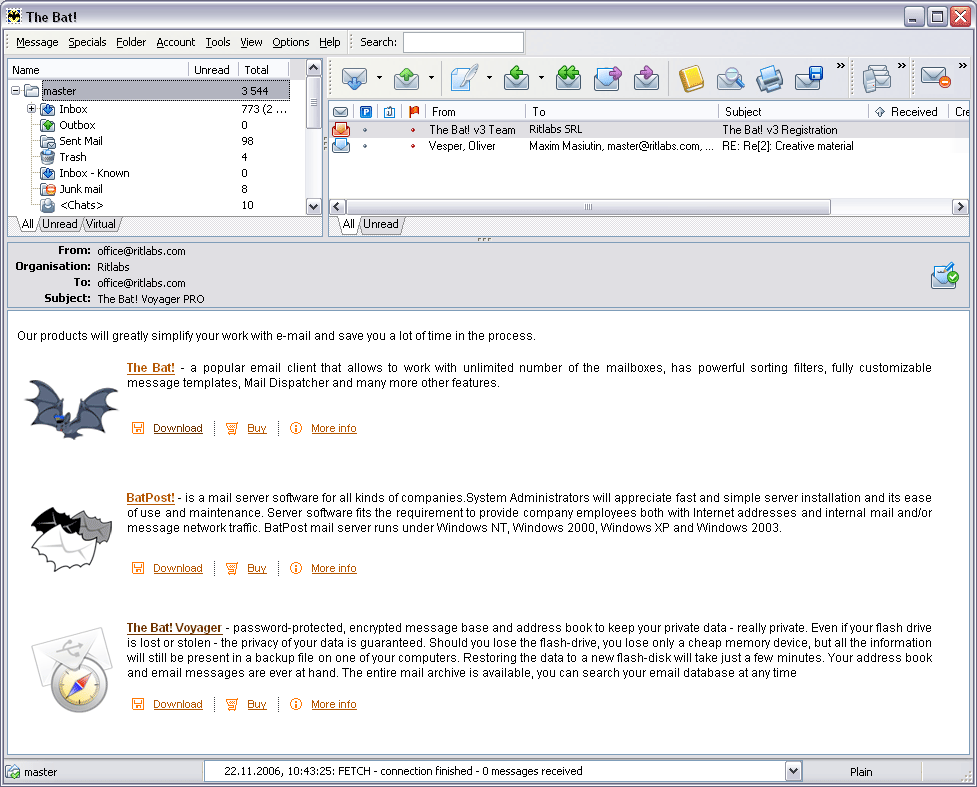
The Bat! 3.95
The Bat! is a powerful, highly configurable, yet easy to use, email client for the casual user or the power user, the home or the office. Unlimited multiple accounts and multiple users Familiar Explorer-style folders for organizing messages Easily configurable user interface with message...
DOWNLOADSoftware Catalog
 Android Android |
Business & Productivity Tools |
| Desktop |
Developer Tools |
| Drivers |
Education |
| Games |
Home & Personal |
| Internet & Networking |
Multimedia & Design |
| Operating Systems |
Utilities |


GraphSight Junior Download
GraphSight Junior 1.0
GraphSight Junior is an easy to use freeware handy 2D math-graphing program. It was originally designed to help students and teachers satisfy their day-after-day math plotting needs. It makes it easy to plot and explore common Y(X) = F(X) Cartesian graphs, set text labels on the coordinate plane, zoom or shift a graph with just a single click & move of mouse. The resulting picture can be than exported to a file or windows clipboard as a bitmap.
Originally GraphSight has come as a realization of the idea "A graph does not have to be dead!". This is gained through the interactivity of every graph on a coordinate plane. All of them react to mouse or keyboard input, each of them have its own shortcut menu, remembers all the formulas you enter for it, can be displayed using different styles, colors and sizes and much more.
Size: 393.8 KB | Download Counter: 23
If GraphSight Junior download does not start please click this:
Download Link 1
Can't download? Please inform us.
Related Software
 GraphSight - GraphSight is a feature-rich 2D math graphing utility with easy navigation, perfectly suited for use by high-school and college math students. The program is capable of plotting Cartesian, polar, table defined, as well as specialty graphs.
 ecGraph - Powerful graphing ActiveX control to create graphs in a huge range of styles. Great for scientific or technical graphs. Do a graph with just a few lines of code. Manipulate the layout at runtime. Multiple graphs. Drag, zoom and scroll. Much more.
 MathCalc - The MathCalc calculate mathematical expressions. The expressions entered, you can save into formula lists. You can plot 2D charts by means tabular data, importing the data from files, or using Cartesian, polar or parametric functions.
 Archim - Archim is a program for drawing the graphs of all kinds of functions. You can define a graph explicitly and parametrically, in polar and spherical coordinates, on a plane and in space (surface). Archim will be useful for teachers and students.
 Advanced Grapher - Graphing, curve fitting and calculating software. Graphs Cartesian, polar and parametric functions, graphs of tables, implicit functions and inequalities. Calculus features: regression analysis, derivatives, tangents, normals and more.
 3D Grapher - Powerful yet easy-to-use graph plotting and data visualization software. You can plot and animate 2D and 3D equation and table-based graphs. The unlimited number of graphs can be plotted in one coordinate system using different colors and lighting.
 MadCalc - MadCalc is a full featured graphing calculator application for your PC running Windows. With MadCalc you can graph rectangular, parametric, and polar equations. Plot multiple equations at once. Change the colors of graphs and the background.
 Rt-Plot - Rt-Plot is a tool to generate Cartesian X/Y-plots from scientific data. You can enter and calculate tabular data. View the changing graphs, including linear and non linear regression, interpolation, differentiation and integration, during entering.
 FNGraph - Graphing and analyzing mathematical functions. Customization of graphs and coordinates system appearance. Support for complex syntax, large variety of functions, user-defined variables. Tools for function evaluation, analysis and integration.
 DataScene - DataScene is a data graphing, animation, and analysis software package. It allows the user to plot 39 types 2D & 3D graphs with brilliant quality, to create graph animations, to analyze data with various methods, and to chart real-time data sources.
 Top Downloads
- Data Curve Fit Creator Add-in
- AVD Volume Calculator
- Math Scratch
- Random Number Generator Pro
- Calculator Prompter
- FindGraph
- CurvFit
- RF21
- Scientific Calculator Decimal
- ESBPDF Analysis - Probability Software

New Downloads
- CurvFit
- Data Curve Fit Creator Add-in
- Regression Analysis - CurveFitter
- Breaktru Quick Conversion
- Calculator Prompter
- FindGraph
- Breaktru Fractions n Decimals
- Random Number Generator Pro
- Math Flight
- MatBasic

New Reviews
- jZip Review
- License4J Review
- USB Secure Review
- iTestBot Review
- AbsoluteTelnet Telnet / SSH Client Review
- conaito VoIP SDK ActiveX Review
- conaito PPT2SWF SDK Review
- FastPictureViewer Review
- Ashkon MP3 Tag Editor Review
- Video Mobile Converter Review
Actual Software
| Link To Us
| Links
| Contact
Must Have
| TOP 100
| Authors
| Reviews
| RSS
| Submit