Recommended Software
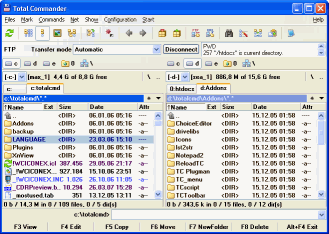
Total Commander 7.01
Total Commander (former Wincmd) is an Explorer replacement for Windows. This is the 32 bit version for Windows 9x, ME, NT, 2000, and XP. A 16 bit version is also available as tc16v656.zip. Total Commander handles archives like subdirectories. It supports...
DOWNLOADSoftware Catalog
 Android Android |
 Business & Productivity Tools Business & Productivity Tools |
 Desktop Desktop |
 Developer Tools Developer Tools |
 Drivers Drivers |
 Education Education |
 Games Games |
 Home & Personal Home & Personal |
 Internet & Networking Internet & Networking |
 Multimedia & Design Multimedia & Design |
 Operating Systems Operating Systems |
 Utilities Utilities |


DynaPlot Download
DynaPlot 3.0
DynaPlot is a real-time chart control for technical and scientific applications. It features dynamic scaling of chart elements with control size, tolerance masks, built-in tools like cursors, markers, scroll, pan, zoom... Although flexible and comprehensive, DynaPlot's programming interface is easy to learn which makes it the tool of choice for both T+M and rapid application development. Examples in VB, VC, VB.NET,C#... help you to get started.
Size: 2.0 MB | Download Counter: 7
If DynaPlot download does not start please click this:
Download Link 1
Can't download? Please inform us.
Related Software
 PlotLab .NET - PlotLab is a set of .NET 2.0-4.0 components for very easy and fast Data Visualization. Allows very fast display in a Plot/Scope/Chart or Waterfall form. Great for FFT Visualization! Free for non-commercial use.
 PlotLab VC++ - PlotLab is a set of Visual C++ components for very easy and fast Data Visualization. They allow very fast display in a Plot/Scope/Chart or Waterfall form. Great for FFT Visualization! Free for non-commercial use.
 PlotLab VCL - Delphi/C++ Builder VCL/FMX components library for very easy and fast Data Visualization. Allows very fast display in a Plot/Scope/Chart or Waterfall form. Great for FFT Visualization! Free for non-commercial use.
 Antaeus - Antaeus is a utility that provides simple way to explore data plots that can be used to confirm or deny the merits of statistical analyses. In Antaeus, the scatter plots become a world of navigable data visualization.
 csXGraph - ActiveX control to draw 2D pie charts, bar charts & line graphs. Display the graphs, export to file (GIF, PNG, BMP) or data stream or copy to the clipboard. Properties allow full control over colours and fonts. Free trial.
 .Net Chart Control - Chart Control .NET is the perfect solution to add the most advanced, feature rich charts to Windows Forms and ASP.NET applications. Over 40 2D/3D charts are available. Uses OpenGL (3D) and GDI+ (2D) for fast-rendering charts.
 Graphic-Chart ActiveX Components - ActiveX Automation HMI Componentcan be widely applied in many industry HMI applications and Simulation environments
 CHEMIX School - CHEMIX School - Software for Chemistry It is equipped with a periodic table, molecular 3-D viewer, curve fit, spectroscopy, conversion table, dictionary and many advanced calculators. Chemistry lessons and problems are included.
 Chart component .Net - Chart Component .NET is a powerful charting component used to create attractive 3D and 2D charts for desktop applications and web pages using .NET technologies. 3D charting uses the OpenGL graphics engine to create sophisticated 3D charts and graphs.
 Visual Data - Scientific data visualization software. Creating vertex, grid and surface model, color map, contour plot, vector plot, 4D scatter, 4D slice and 4D vector.

 Top Downloads
- PDF Info
- PDF Vista
- Zortam Mp3 Media Studio
- KB Piano
- Name Maker LE
- Photo Effects
- Universal Converter
- Wavepad Audio Editor
- Easy FlashMaker (SWF Creator)
- Media Encoder Console

 New Downloads
- Zortam Mp3 Media Studio
- Bandicam
- Usability Studio
- MakeUp Pilot
- HyperCam
- Wire Pilot
- Vocal Remover
- IncrediShow
- CollageIt
- A Ruler for Windows

New Reviews
- jZip Review
- License4J Review
- USB Secure Review
- iTestBot Review
- AbsoluteTelnet Telnet / SSH Client Review
- conaito VoIP SDK ActiveX Review
- conaito PPT2SWF SDK Review
- FastPictureViewer Review
- Ashkon MP3 Tag Editor Review
- Video Mobile Converter Review
Actual Software
| Link To Us
| Links
| Contact
Must Have
| TOP 100
| Authors
| Reviews
| RSS
| Submit
