

Recommended Software
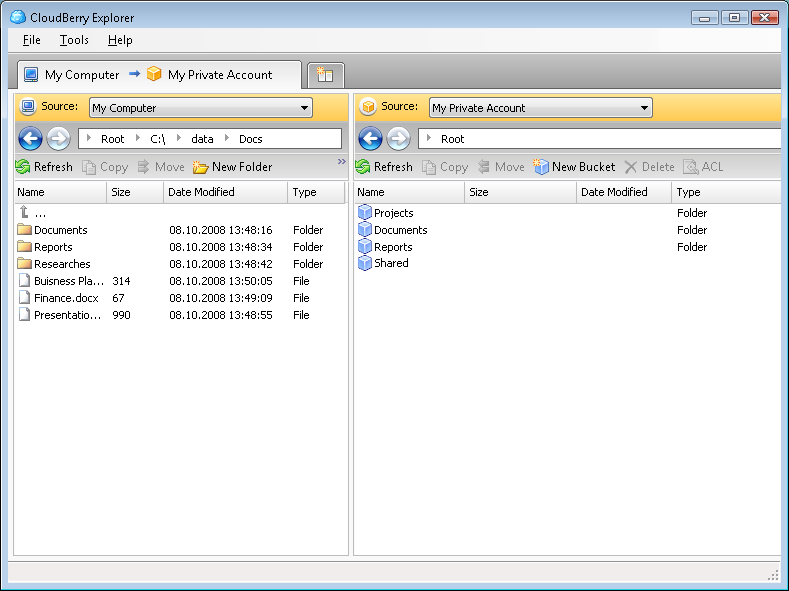
CloudBerry Explorer for Amazon S3 1.5.1.39
CLOUDBERRY EXPLORER FOR AMAZON S3 CloudBerry S3 Explorer makes managing files in Amazon S3 EASY. By providing an industry leading user interface (GUI) to Amazon S3 accounts, files, and buckets, CloudBerry lets you manage your files on cloud just as you would on your own local computer. New...
DOWNLOADSoftware Catalog
 Android Android |
Business & Productivity Tools |
| Desktop |
Developer Tools |
| Drivers |
Education |
| Games |
Home & Personal |
| Internet & Networking |
Multimedia & Design |
| Operating Systems |
Utilities |


DataScene
DataScene 1.8.1.1


Category:
Business & Productivity Tools / Graphics
| Author: CyberWit, Inc.
DOWNLOAD
GET FULL VER
Cost: $219.00 USD
License: Shareware
Size: 44.1 MB
Download Counter: 23
* Plotting 39 types of graphs with brilliant graph quality.
* 3D canvas for most graph types.
* A wide variety of highly customizable graphical elements: transparent color, solid brush, gradient brush, image brush, hatch brush with 56 textures, shadow, visual aspect settings, etc.
* Highly customizable and feature-rich graph axes, legend, marks, titles, and walls.
* Rich text graph annotations with a WYSIWYG editor.
* Supporting 16 built-in graph themes and custom theme.
* Analyzing and processing data using column and cell formulas.
* Processing graphs with various methods: Cublic Spline, Moving Average, Integrate, Differentiate, FFT, Curve Fitting, etc.
* Powerful math parser supporting various built-in mathematical and text functions, including special functions such as Bessel, Beta, Gamma, Error, Hypergeometric, etc.
* Creating graph animation using time-dependent mathematical formulas and sequences of data.
* Monitoring, charting, and processing real-time data.
* Importing data from MS Excel, various text formats, ODF spreadsheets, and MS Access databases.
* Exporting to a variety of graph formats: BMP, JPG, TIFF, PNG, GIF, EMF, PostScript, and PDF.
* Exporting animated graphs and charts to AVI and animated GIF for offline playback.
* Super clean, friendly, context-sensitive, and configurable user interface.
* A rich set of graphical and data tools.
* Automatic graph update and result recalculation upon data source change.
Requirements: 1 GHz CPU, 512 MB RAM, 100 MB free disk space, 32 MB graphics card.
OS Support:
Language Support:
Related Software
3d | Animation | Area | Bar | Data Analysis | Data Backup Software | Data Entry Software | Data Monitoring | Data Presentation | Data Recovery Software | Data Recovery Software M | Graphing Software | Imdb graph data | Line | Linear Regression | Merge Data Software | Pie | Plotting | Scientific
 Advanced Grapher - Graphing, curve fitting and calculating software. Graphs Cartesian, polar and parametric functions, graphs of tables, implicit functions and inequalities. Calculus features: regression analysis, derivatives, tangents, normals and more.
 FindGraph - FindGraph is a graphing, curve-fitting, and digitizing tool for engineers, scientists and business. Discover the model that best describes your data.
 Regression Analysis - CurveFitter - CurveFitter program performs statistical regression analysis to estimate the values of parameters for linear, multivariate, polynomial, exponential and nonlinear functions.
 Advanced Graph and Chart Collection for PHP - The PHP graphing scripts provide a very easy way to embed dynamically generated graphs and charts into PHP applications and HTML web pages.Very easy to use and add professional quality graphing to web pages / applications in minutes. Try for free.
 Equation graph plotter - EqPlot - Graph plotter program plots 2D graphs from complex equations. The application comprises algebraic, trigonometric, hyperbolic and transcendental functions. EqPlot can be used to verify the results of nonlinear regression analysis program.
 3D Multi Series Bar Graph - This applet is designed to take multiple series of numerical data and display the information as a 3D Multi series Bar Chart. The applet will automatically size itself to the available area given to it by the HTML form.
 Rt-Plot - Rt-Plot is a tool to generate Cartesian X/Y-plots from scientific data. You can enter and calculate tabular data. View the changing graphs, including linear and non linear regression, interpolation, differentiation and integration, during entering.
 2D/3D Line Graph for PHP - This PHP script provides a very easy way to embed dynamic line graphs to PHP apps and web pages. Very easy to use and it's perfectly possible to add professional quality real time graphing to web pages & apps within minutes. Try for free.
 MadCalc - MadCalc is a full featured graphing calculator application for your PC running Windows. With MadCalc you can graph rectangular, parametric, and polar equations. Plot multiple equations at once. Change the colors of graphs and the background.
 DPlot - Graphing software for scientists, engineers, and students. It features multiple scaling types, including linear, logarithmic, and probability scales, as well as several special purpose XY graphs and contour plots of 3D data.
 Top Downloads
- The Myspace Editor
- MultiExtractor
- Optimik
- Kalimages Foto IPTC editor em Portugues
- Exif Pilot
- Bulk Image Downloader
- Cylekx
- Life Poster Maker
- Edraw Flowchart Software
- 1 - Easy Calendar Maker Program!

New Downloads
- Bulk Image Downloader
- WeatherStudio
- Tiff Paging
- FunPhotor
- ColorMania
- PDF Combine
- TiffCombine
- IconUtils
- iGrid
- Capturix ScanShare

New Reviews
- jZip Review
- License4J Review
- USB Secure Review
- iTestBot Review
- AbsoluteTelnet Telnet / SSH Client Review
- conaito VoIP SDK ActiveX Review
- conaito PPT2SWF SDK Review
- FastPictureViewer Review
- Ashkon MP3 Tag Editor Review
- Video Mobile Converter Review
Actual Software
| Link To Us
| Links
| Contact
Must Have
| TOP 100
| Authors
| Reviews
| RSS
| Submit